
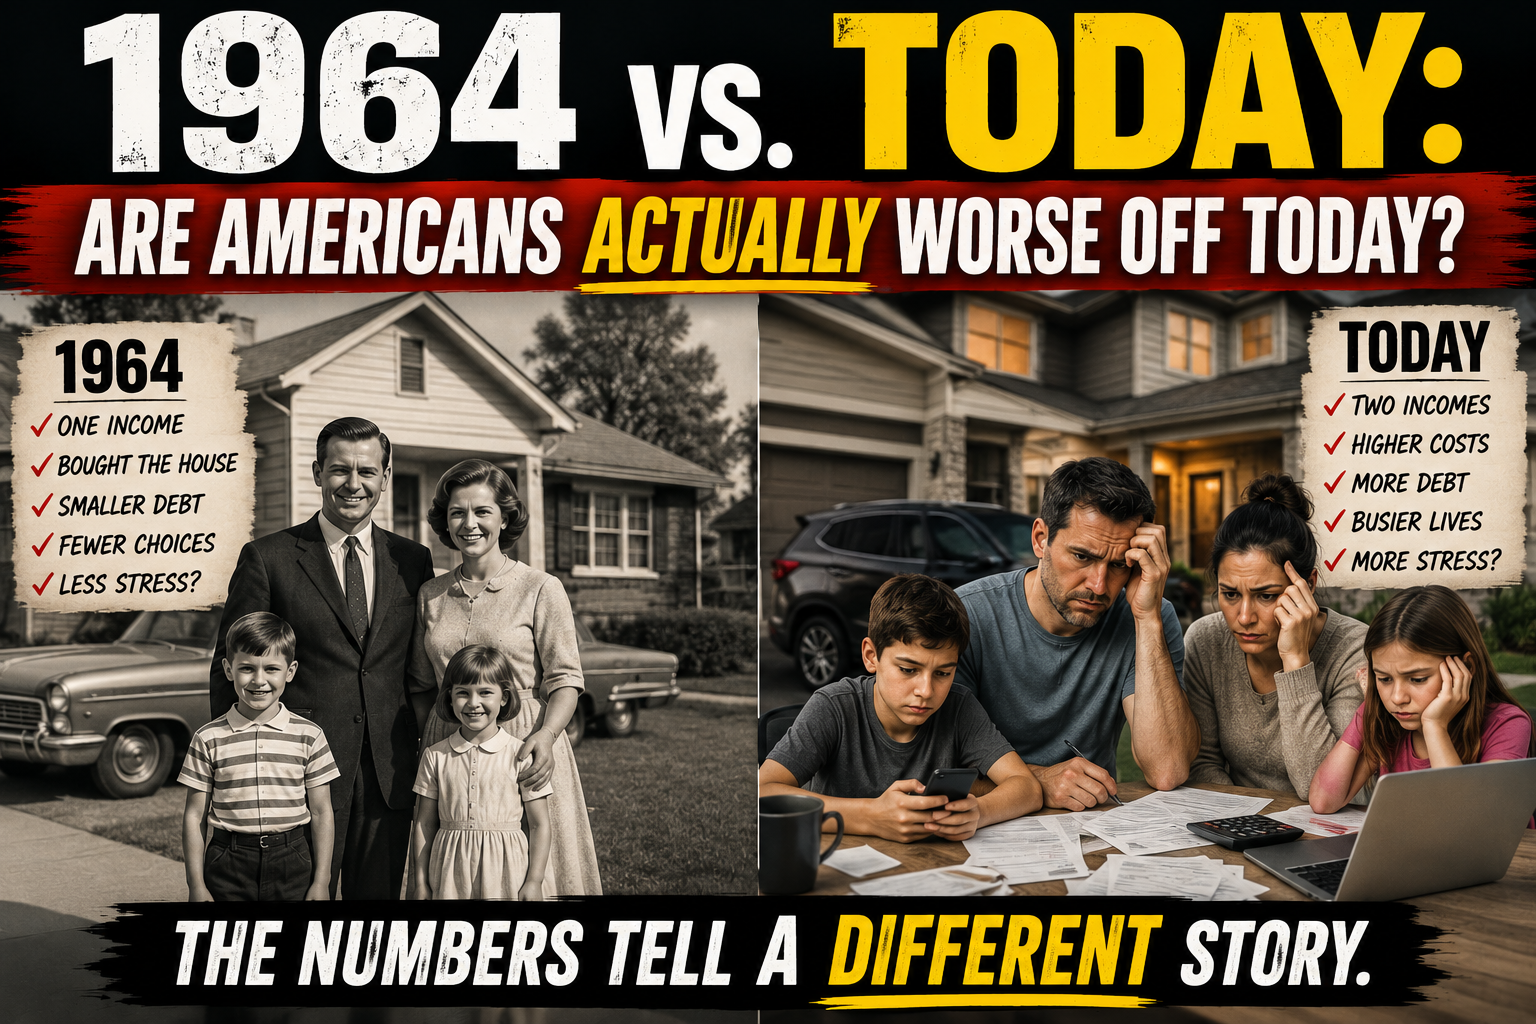
There is a popular idea that the typical American family was better off financially in the 1960s than it is today.
One income bought the house. Mom could stay home. Dad went to work. College was cheap. Houses were cheap. Healthcare was cheap.
Meanwhile, today’s Americans supposedly work harder just to keep their heads above water.
But is that actually what the data show?
I wanted to look at this question from several different angles because simply comparing wages—or even household income—can give us a misleading picture of how American living standards have changed.
So let’s go back to 1964 and compare it with today.
First, Let’s Look at Wealth
One of the most straightforward measures is household net worth.
Historical estimates of median household wealth show that the median American household had roughly $60,000 of net worth in the early 1960s when expressed in today’s purchasing power.
By 2022, median household net worth was roughly three times that level in real terms.
This means that after adjusting for inflation, the median household owns substantially more net wealth than its counterpart in the early 1960s.
So by this measure alone, the median American household is wealthier.
But there’s a catch.
GDP Grew Even Faster
When we indexed both median household wealth and real GDP per capita to 100 in the early 1960s, something interesting happened.
GDP per capita grew considerably faster than median household wealth for much of the period.
That could easily lead someone to conclude:
“See! The economy got richer, but ordinary Americans didn’t.”
But that’s not quite true is?
While median household wealth didn’t grow as quickly as GDP per capita, that’s very different from saying median households didn’t get wealthier.
Imagine your real income rises from $50,000 to $100,000 while the economy around you triples in size.
You didn’t keep pace with the overall economy.
But you’re still earning twice as much in real purchasing power.
Both things can be true simultaneously.
And that’s why I don’t think comparing household wealth with GDP tells us everything we want to know.
So Let’s Look at Income
Real median family income has also increased substantially since the 1960s.
Our indexed comparison showed roughly an 80% increase in real median family income between 1964 and the early 2020s.
That’s not remotely as fast as GDP per capita.
But again, we’re talking about an inflation-adjusted increase.
The typical family has considerably more real income than its counterpart did six decades ago.
There is another enormous demographic change we need to consider, though.
Households Are Much Smaller
The average American household contained roughly 3.2 people in the mid-1960s.
Today it’s closer to 2.6 people.
That’s about a 20% decline in household size.
This matters enormously when comparing household income.
Suppose Household A earns $60,000 and supports four people.
Household B earns $90,000 and supports two people.
Simply saying Household B earns 50% more misses a big part of the improvement in its economic circumstances.
So we calculated another measure:
Real Income Per Household Member
We divided real median household/family income by average household size.
The result was striking.
With 1964 set to 100, our approximate real median income per household member reached roughly 220–225 by 2022.
In other words, real income relative to the number of people being supported by the household more than doubled.
That tells a considerably different story from simply looking at hourly wages.
And speaking of wages…
What About Real Hourly Wages?
This is where the story gets particularly interesting.
We added average hourly earnings for production and nonsupervisory private-sector workers and adjusted those wages for inflation.
This series covers the majority of private-sector workers and goes back to 1964.
Real hourly wage growth was surprisingly modest compared with our other measures.
With 1964 = 100, the real hourly wage index was only around 114 by 2022 in our comparison.
That’s roughly a 14% real increase.
And this is one reason you’ll frequently hear claims that American workers have barely made any progress over the last half-century.
If you concentrate exclusively on this particular wage measure, that argument looks pretty compelling.
But then something strange happens.
Americans Are Consuming Far More
We also looked at real personal consumption expenditures per capita.
This measures the inflation-adjusted quantity of goods and services Americans consume.
And this number exploded.
With 1964 = 100, real consumption per person had climbed to roughly 355 by 2022.
That’s an increase of approximately 255%.
Think about the contrast:
Real hourly wages: roughly +14%
Real median income per household member: roughly +125%
Real median household wealth: roughly +170% or more
Real GDP per capita: roughly +195%
Real consumption per person: roughly +255%
Those numbers are telling us something important.
Looking at hourly wages alone gives us an extremely incomplete picture of the improvement in American living standards.
How Can Consumption Rise So Much Faster Than Wages?
That’s the obvious question.
If hourly wages supposedly barely increased, how can Americans possibly be consuming dramatically more?
There isn’t one single answer.
Compensation is more than hourly cash wages. Employer-paid benefits have become a much larger component of total employee compensation.
Household composition has changed.
Government transfer programs have changed.
The number and types of goods and services households purchase have changed.
Labor-force participation patterns changed dramatically, particularly among women.
Capital income and retirement assets matter.
Taxes matter.
And the CPI adjustment itself can’t perfectly capture every improvement in the quality of goods and services over six decades.
Consider what a middle-class household owns today compared with 1964.
Multiple televisions, computers, smartphones, high-speed internet, air conditioning, dramatically safer automobiles, modern appliances, streaming entertainment and access to medical treatments that simply didn’t exist in 1964 are commonplace.
None of that means housing, healthcare or college haven’t become more expensive.
They have.
But we shouldn’t confuse the rising cost of particular necessities with a decline in the entire American standard of living.
What About More Workers Per Household?
I initially suspected another explanation might be that households simply have many more workers today.
After all, female labor-force participation increased enormously after the 1960s.
But when we looked at workers per household, the story became more complicated.
Workers per household appear to have remained surprisingly stable over the long run.
There was a huge change within households—particularly the rise of two-earner married couples—but other demographic changes offset much of that increase when looking at all households.
The population has aged.
There are more retiree households.
There are more single-person households.
Households have become smaller.
So the dramatic increase in real income per household member cannot simply be dismissed as:
“Of course households make more money. Now everybody has to work.”
The actual demographic story is much more complicated.
The Great Recession Really Did Hammer Household Wealth
There is another lesson buried in the data.
Median household wealth collapsed after the housing crash.
Our indexed wealth series falls dramatically between 2007 and 2010.
That’s not surprising.
For middle-class households, their home represents a substantial percentage of total net worth.
The collapse in housing prices therefore hit median wealth much harder than it hit GDP per capita.
That helps explain why the post-2008 period felt so economically destructive even though GDP eventually recovered.
Median household balance sheets took much longer to recover.
By 2022, however, median net worth had rebounded dramatically.
That recovery matters when making comparisons with the 1960s.
So Are Americans Richer Than in 1964?
The evidence overwhelmingly supports saying yes.
That doesn’t mean every American is richer.
It doesn’t mean inequality hasn’t increased.
It doesn’t mean housing isn’t expensive.
It doesn’t mean healthcare isn’t expensive.
And it certainly doesn’t mean every economic problem facing younger Americans is imaginary.
But those are different questions.
If our question is:
“Does the typical American household command more real economic resources today than it did in the mid-1960s?”
The evidence strongly suggests that it does.
Real household wealth is substantially higher.
Real household income is substantially higher.
Real income per household member has more than doubled in our comparison.
Real consumption per person has more than tripled.
And Americans have access to goods, services, technologies and medical care that couldn’t have been purchased at virtually any price in 1964.
GDP Isn’t the Same Thing as Your Bank Account
Perhaps the most important lesson from this exercise is how careful we need to be when comparing household finances with GDP.
GDP per capita has grown faster than median household wealth over much of this period.
That’s worth studying.
It tells us something about how economic growth has been distributed.
But it does not tell us that the median household became poorer.
Those are two entirely different claims.
A household can become much wealthier while simultaneously receiving a smaller share of an even faster-growing economic pie.
That’s essentially what our data appear to show.
The “Good Old Days” Were More Complicated Than We Remember
There were certainly things about the 1960s economy that look attractive today.
Housing was cheaper relative to income in many areas.
College was dramatically cheaper.
Many workers had defined-benefit pensions.
And a single paycheck supporting a traditional family was more common.
But those facts shouldn’t be turned into the much broader claim that Americans were economically better off overall.
The typical household today has substantially more real wealth.
It has more real income per person.
It consumes dramatically more goods and services.
Homes are larger.
Cars are safer and more reliable.
Technology that would have seemed like science fiction in 1964 is sitting in virtually everyone’s pocket.
The American economy has changed enormously over the last six decades.
Not every change has been positive.
Not everyone benefited equally.
But if we’re going to debate whether Americans are better or worse off than their parents and grandparents, we should at least look at the entire economic picture.
And once we do that, the idea that the typical American has made virtually no economic progress since the 1960s becomes very difficult to defend.