
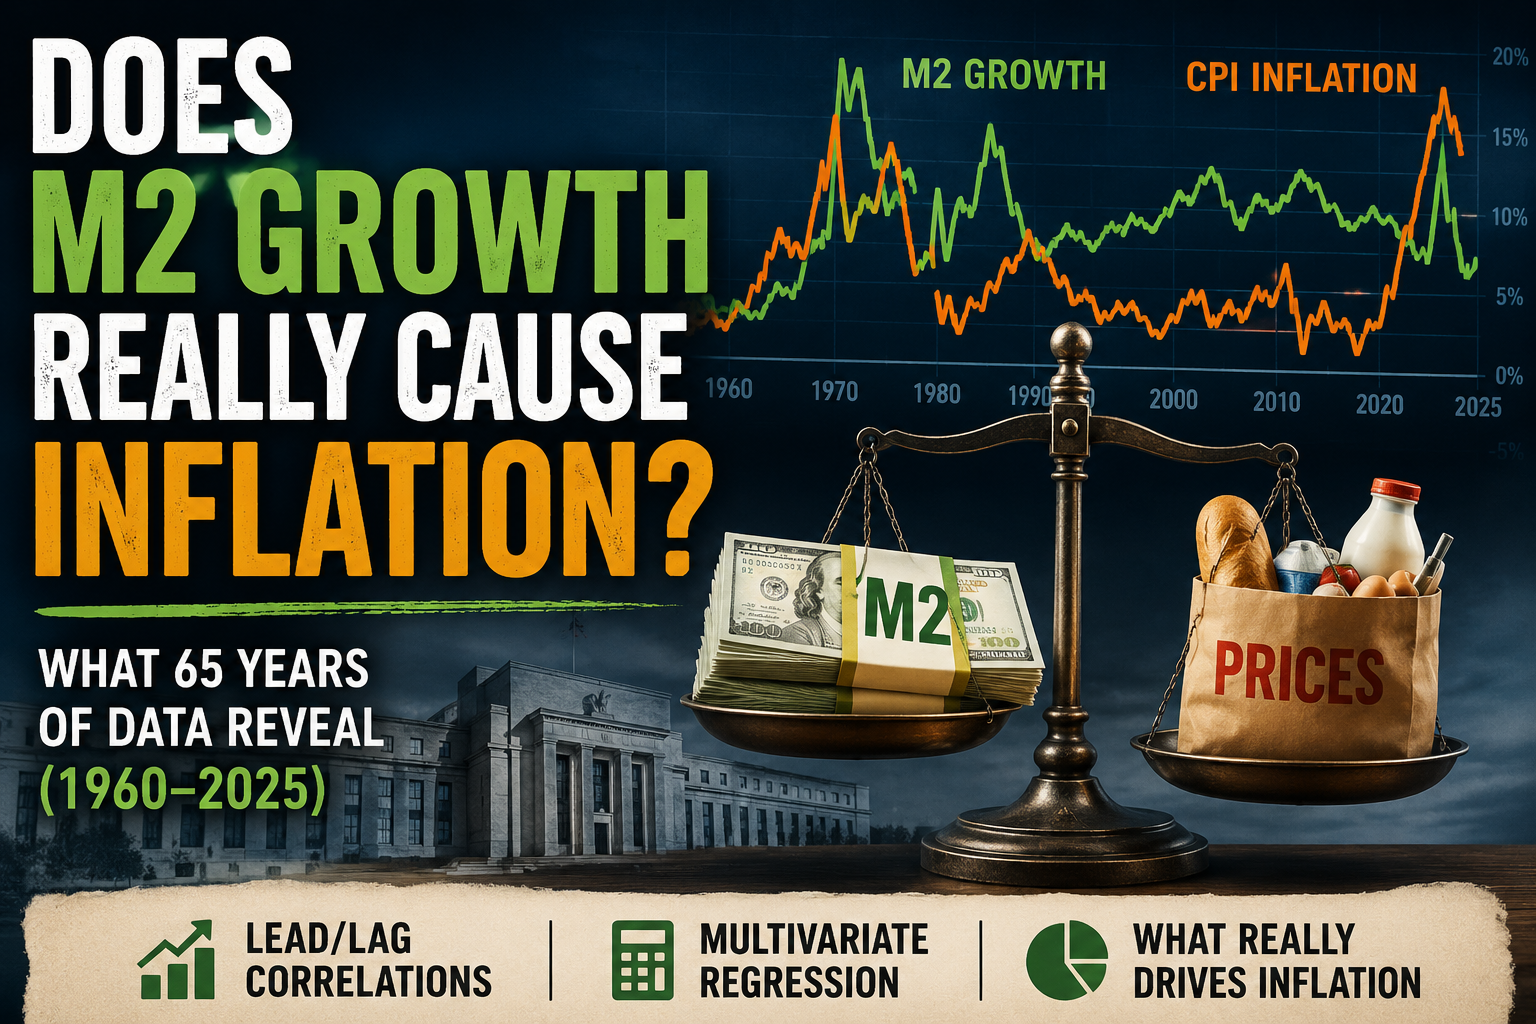
One of the most widely repeated ideas in economics is that rapid growth in the money supply causes inflation.
Milton Friedman famously argued that inflation is ultimately a monetary phenomenon. And the logic seems straightforward: if you create a lot more money without creating a corresponding amount of goods and services, shouldn’t prices rise?
That makes intuitive sense.
But when we actually look at the historical U.S. data, something interesting happens.
M2 growth by itself isn’t a particularly good predictor of inflation.
That doesn’t mean money doesn’t matter. Far from it.
It means the relationship between money and inflation is considerably more complicated than simply:
More M2 = more inflation.
Let’s look at the numbers.
What Happened From 1960 Through the Great Inflation?
First, let’s divide the period surrounding the Great Inflation into several smaller periods.
We’ll compare four things:
- M2 money-supply growth
- Nominal GDP growth
- Real GDP growth
- CPI inflation
Because these periods have different lengths, we’ll annualize all of the growth rates.
| Period | M2 Growth | Nominal GDP Growth | Real GDP Growth | CPI Inflation |
|---|---|---|---|---|
| 1960–1964 | ~6.0% | ~5.6% | ~4.3% | 1.2% |
| 1965–1968 | ~9.2% | ~8.3% | ~4.7% | 3.4% |
| 1969–1974 | ~8.8% | ~8.7% | ~2.7% | 6.1% |
| 1975–1980 | ~10.2% | ~11.3% | ~3.7% | 8.9% |
| 1981–1985 | ~9.5% | ~7.9% | ~3.5% | 4.3% |
There’s definitely something here.
From 1960–1964, M2 grew only about 6% annually and inflation averaged roughly 1%.
Then M2 growth accelerated dramatically.
From 1965–1968, M2 grew more than 9% annually.
Inflation subsequently accelerated as well.
By 1975–1980, M2 was growing more than 10% annually and inflation was approaching 9%.
At first glance, that looks like a slam dunk for the argument that money growth causes inflation.
But then something strange happens.
Look at 1981–1985
Inflation collapsed.
Yet M2 growth didn’t.
Compare these two periods:
1975–1980
M2 growth: 10.2%
Real GDP growth: 3.7%
CPI inflation: 8.9%
1981–1985
M2 growth: 9.5%
Real GDP growth: 3.5%
CPI inflation: 4.3%
That’s fascinating.
M2 growth declined by less than one percentage point.
Real economic growth was also fairly similar.
Yet inflation was cut roughly in half.
If M2 growth were the primary mechanical determinant of inflation, this would be difficult to explain.
Clearly something else was going on.
Enter the Velocity of Money
This is where the velocity of money becomes important.
The classic quantity equation is:
M × V = P × Y
Where:
M = money supply
V = velocity of money
P = price level
Y = real economic output
Velocity basically measures how quickly money circulates through the economy.
If we approximate the equation using growth rates, we get:
Money growth + velocity growth ≈ inflation + real economic growth
Now add velocity to our historical comparison:
| Period | M2 Growth | Real GDP | CPI Inflation | M2 Velocity |
|---|---|---|---|---|
| 1960–1964 | ~6.0% | ~4.3% | 1.2% | 1.78 → 1.67 ↓ |
| 1965–1968 | ~9.2% | ~4.7% | 3.4% | 1.68 → 1.73 ↑ |
| 1969–1974 | ~8.8% | ~2.7% | 6.1% | ~1.76 → 1.75 |
| 1975–1980 | ~10.2% | ~3.7% | 8.9% | 1.75 → 1.86 ↑ |
| 1981–1985 | ~9.5% | ~3.5% | 4.3% | 1.91 → 1.80 ↓ |
Now the Volcker period starts making more sense.
During the late 1970s, M2 was growing rapidly and velocity was rising.
After 1981, M2 continued growing rapidly, but velocity began falling.
The same amount of money growth therefore didn’t necessarily create the same amount of nominal spending pressure.
This is our first warning against looking at M2 in isolation.
But Which Comes First: M2 or Inflation?
That’s the question that really matters.
Maybe inflation simply causes M2 to rise.
As prices increase, households and businesses need more dollars to conduct the same amount of transactions. Banks create deposits through lending. The Federal Reserve may accommodate the increased demand for money.
So causality could conceivably run in both directions.
We can test this by looking at lead/lag correlations.
Instead of simply comparing M2 and inflation during the same year, ask:
Does higher M2 growth today tend to be followed by higher inflation later?
And then reverse it:
Does higher inflation today tend to be followed by higher M2 growth later?
Here’s what we found.
M2 Does Appear to Lead Inflation
Using annual U.S. data, the contemporaneous relationship between M2 growth and inflation is surprisingly weak.
The same-year correlation was only about:
R = 0.07
That’s almost nothing.
But move inflation forward a couple of years and the relationship gets stronger.
| Relationship | Correlation |
|---|---|
| M2 → CPI same year | 0.07 |
| M2 → CPI 1 year later | 0.21 |
| M2 → CPI 2 years later | 0.40 |
| M2 → CPI 3 years later | ~0.37 |
And when we looked at the pre-pandemic 1960–2019 period, the strongest relationship occurred at roughly three years:
M2 growth → CPI three years later: R ≈ 0.48
That’s a moderate positive correlation.
So there does appear to be evidence that unusually high M2 growth tends to precede higher inflation.
But here’s where we need to be careful.
An R of 0.48 Isn’t Nearly as Strong as It Sounds
A correlation of 0.48 certainly isn’t meaningless.
But square the correlation coefficient and you get:
R² = 0.48² = 0.23
Or roughly:
23%.
In a simple two-variable relationship, that means only about 23% of the variation in subsequent inflation is statistically associated with M2 growth three years earlier.
That’s meaningful.
But it certainly isn’t deterministic.
Roughly 77% of inflation’s variation isn’t captured by M2 growth alone in that simple relationship.
At the two-year lag, the relationship is weaker still:
R = 0.40
Therefore:
R² = 16%.
Again, M2 matters.
But M2 isn’t explaining anything close to all of the variation in inflation.
What If Inflation Comes First?
Now let’s reverse the test.
Instead of:
M2 → inflation two years later
we test:
Inflation → M2 two years later.
The correlation falls to approximately:
R = 0.21
Square that:
R² ≈ 4.4%.
That’s very weak explanatory power.
So we get an interesting asymmetry.
M2 first → inflation two years later
R = 0.40
R² = 16%
Inflation first → M2 two years later
R = 0.21
R² = 4.4%
The historical relationship is substantially stronger when M2 comes first.
That’s evidence against the idea that the entire relationship simply reflects inflation causing the money supply to increase.
But it’s still nowhere close to proving that M2 determines future inflation.
And Same-Year M2 Is Almost Useless
Here’s perhaps the most surprising result.
When annual inflation is regressed against M2 growth during the same year, the R² is only about:
0.5%.
Think about what that means.
If I told you nothing about the economy except how much M2 grew during a particular year, that information by itself would tell you remarkably little about that year’s inflation rate.
That’s an important distinction.
It doesn’t mean money doesn’t matter.
It suggests that the transmission mechanism is neither immediate nor mechanical.
Money growth can occur.
People can hold that money rather than spend it.
Velocity can fall.
Production can increase.
Banks can alter lending.
Interest rates can change.
Asset prices can move.
Inflation expectations can change.
And fiscal policy can affect where newly created deposits actually end up.
Eventually some combination of those factors determines nominal spending.
So Was Milton Friedman Wrong?
I don’t think that’s what these numbers establish.
There’s a much more nuanced distinction.
Saying:
“Sustained inflation is ultimately a monetary phenomenon”
is not necessarily the same as saying:
“M2 growth is the primary short-term predictor of CPI inflation.”
The first proposition can be true without the second being true.
Money provides the nominal purchasing power necessary to sustain continually rising prices.
But M2 is a particular statistical definition of money, and the relationship between M2 and spending depends heavily on what people actually do with those balances.
That’s where velocity enters the picture.
The Equation Explains Why
Remember:
M × V = P × Y
Suppose M2 increases 10%.
If real production increases 4% and velocity falls 5%, there isn’t much left to push prices higher.
But suppose M2 increases 10%, real production grows only 2%, and velocity increases 2%.
Now you potentially have enormous nominal spending pressure.
Same M2 growth.
Very different inflation outcome.
That’s essentially what our historical data are telling us.
This Also Helps Explain the Volcker Years
The conventional story of the early 1980s is that Paul Volcker crushed inflation by imposing extremely tight monetary policy.
That’s certainly true in the broader sense of monetary conditions.
Interest rates soared. Credit became expensive. Economic activity weakened. Inflation expectations changed dramatically.
But here’s the fascinating part:
M2 itself continued growing rapidly.
From 1975–1980:
M2 growth ≈ 10.2% annually
From 1981–1985:
M2 growth ≈ 9.5% annually
Yet inflation fell from roughly:
8.9% → 4.3%.
The major difference wasn’t simply the quantity of M2.
The environment in which that money existed had changed dramatically.
Most importantly for our simple quantity equation, velocity declined.
What Can We Actually Conclude?
I think the historical evidence supports several conclusions.
First, rapid M2 growth can be an important warning sign for future inflation.
The lead/lag analysis suggests M2 growth tends to precede inflation rather than merely follow it.
Second, the lag appears to be long and variable.
The strongest simple historical relationships appear roughly two to three years later, not immediately.
Third, M2 alone is a weak inflation forecasting tool.
Even our strongest simple relationship explains only about 20%–25% of subsequent inflation variation.
Fourth, velocity matters enormously.
Two periods with nearly identical M2 growth can produce dramatically different inflation outcomes when velocity behaves differently.
Fifth, real economic growth matters too.
An economy capable of producing substantially more goods and services can absorb more nominal spending without generating the same increase in prices.
And finally, correlation isn’t causation.
Oil shocks, fiscal policy, monetary policy, credit creation, productivity, supply constraints, expectations and numerous other variables interact with money growth.
The Better Way to Think About Inflation
Instead of asking:
“How fast is M2 growing?”
we probably need to ask:
“How fast is money growing relative to real output—and what is happening to the willingness of people to spend that money?”
That’s a much different question.
And it helps reconcile something that otherwise looks contradictory.
The United States experienced periods of rapid M2 growth with relatively modest inflation.
It also experienced periods of rapid M2 growth accompanied by enormous inflation.
The difference wasn’t simply the amount of money.
It was what happened to that money once it existed.
So perhaps the historical record doesn’t overturn Friedman’s famous monetary insight.
But it does give us a strong reason to reject an overly simplistic version of it:
M2 growth does not mechanically determine future inflation.
Money matters.
But money, velocity, real production, credit conditions, expectations and policy all matter together.