(I am about to offend someone… unsubscribe right now! Before you get offended! Just click the bottom of this email for the link to do this. Do it now!)
I had to chuckle a bit when I read Brian Wesbury’s latest bit on the Fed where he wrote:
“The Fed’s balance sheet held $850 billion in reserves at the end of 2007. Today, it is close to $9 trillion. Most of these deposits at the Fed are bank reserves which the Fed created by buying Treasury bonds, much of which was money the Treasury itself handed out during the pandemic. At this point, if we add excess reserves to reverse repos, there are over $5 trillion in excess money in the system.
Technically, banks can do whatever they want with these reserves as long as they meet the capital and liquidity ratio requirements set by regulators. They can hold them at the Fed and get the interest rate the Fed sets, or they can lend them out at current market interest rates. In turn, the big question is whether the Fed can pay banks enough to stop them from lending in the private marketplace and multiplying the money supply.”(emphasis mine and just to be clear, I’m a HUGE fan of Brian Wesbury. His take on inflation and its causes frustrates me to no end though.)
Anyone wanna take a stab and ask what could be wrong in his thinking? Anyone? Is there anyone out there that sees the problem here? Someone other than me has to see the problem that could arise here, no? (It’s kinda like asking about the Van Allen radiation belt. You see the problem, no?)
For banks to lend and multiply the money supply and thus, in theory at least, increase inflation you need a…BORROWER. Borrowers don’t just show up because rates are low and banks have money to lend. So you can posit all you want about how low rates and bank lending will increase the money supply and cause inflation but you need to answer the question of who exactly will be doing the borrowing?
We have recent history from our good buddies in Japan to look at. And once again to cite verbatim from Richard Koo’s book “The Holy Grail of MacroEconomics – Lessons From Japan’s Great Recession”:
The central banks implementation of quantitative easing at a time of zero interest rates was similar to a shopkeeper who, unable to sell more than 100 apples, tries stocking his shelves with 1,000 apples and when that has no effect, adds another 1,000.
Today’s macroeconomics assumes private-sector firms (and households) are maximizing profits at all times, meaning given a low enough interest rate they should be willing to borrow money to invest…But when there are no borrowers, the bank (in our case the US FED) is powerless. Anyone working in the financial sector is well aware that Japan suffers from an acute shortage of borrowers.
In an economy where everyone is (paying down) debt, the money multiplier will turn negative at the margin. In short, independent monetary policy ceases to exist when there is no demand for funds from the private sector.”
Koo shares example after example of Japan’s balance sheet recession. It mattered not what interest rates were, people were scared to borrow because of what they saw happened in the mid 1990s.
Do you think people in the good ole USofA don’t remember what happened in the aughts here? Of course they do and I’m telling you, they don’t want to go through that again. Offer zero-interest financing and many people are gonna be like “Nah…I’ll pass.”
Oh many, many people will look at a graph like the one below and say “Look Josh, you’re wrong! Look at that huge increase in debt in the last 10 years! I should never have listened to you!”
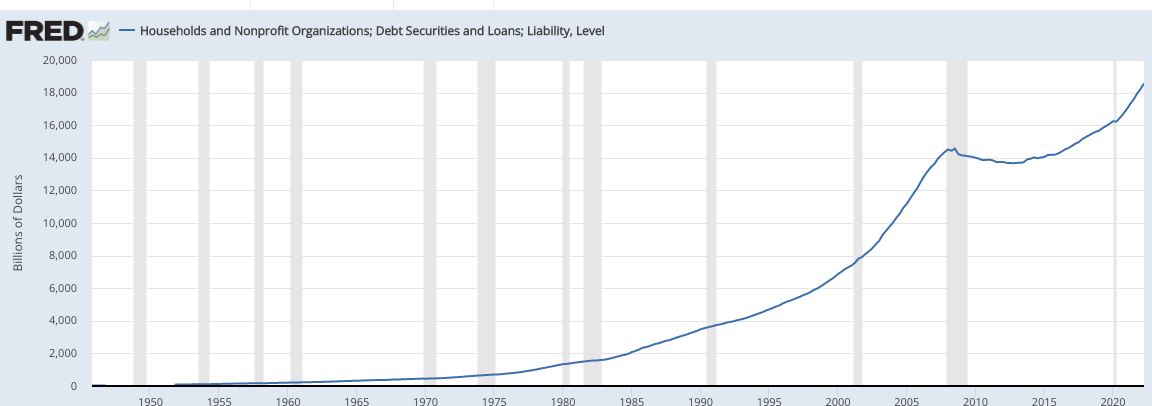
To which I’ll invite them to unsubscribe AFTER they see this graph though.
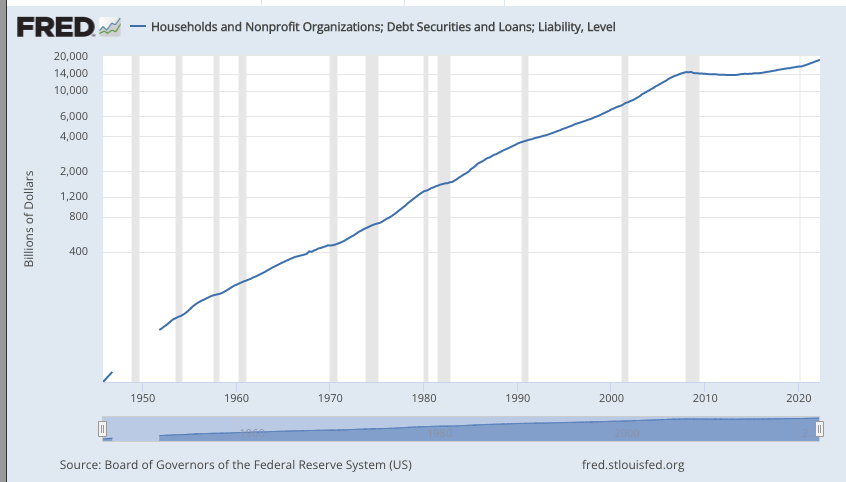
Literally the exact same graph except the second is logged, meaning it’s based on percentage changes not actual dollar amount changes. It is percentages that are meaningful when dealing with time. Notice the last 10 years? Not a huge change in consumer debt, compared to previous periods. Interesting eh?
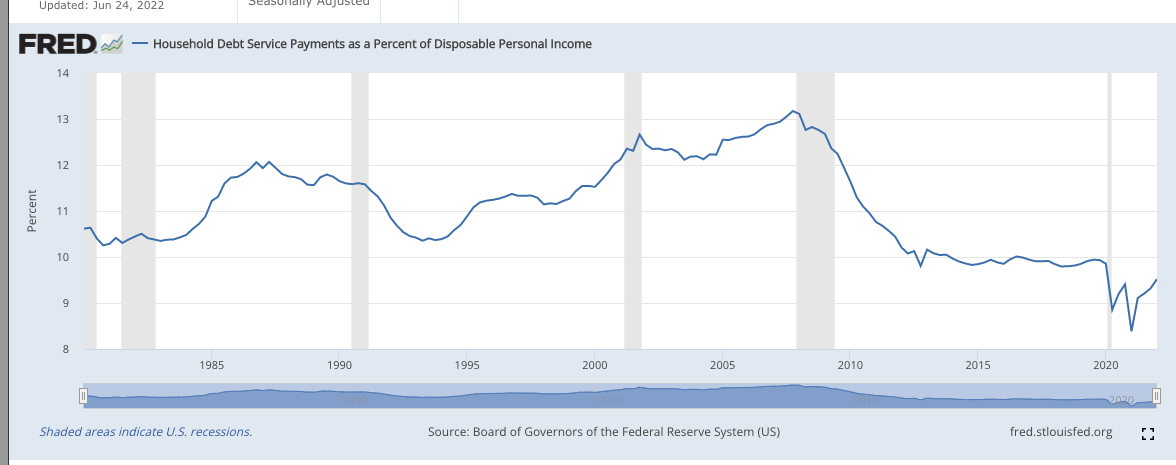
One of my favorite charts is the one below which shows debt payments as a percentage of disposable income. Notice in 2008 it started dropping like a brick in water…even though for the next 10 years interest rates were the lowest they had ever been!
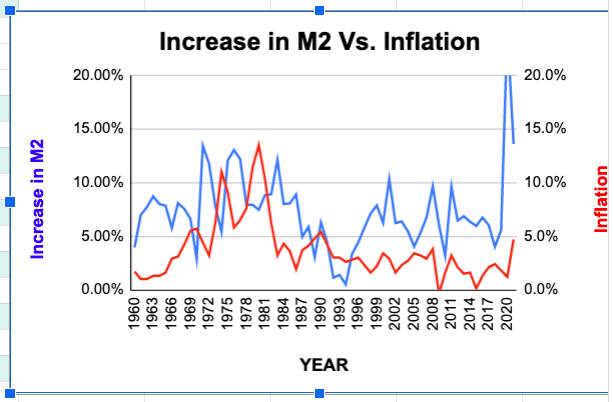
Lastly, in the chart below focus on the red line, which is inflation. Start in 1981 and notice it dropped consistently until 2021.
The blue line represents the increase in M2 Money supply. See a correlation? Of course not! M2 dropped from 1983 or so to the late 90s then started rising from the ashes like a Phoenix. Yet inflation went where? Stayed low.
Why? Fewer borrowers. 2008 came and KABOOM, many American households and businesses said ‘nyet” to further borrowing. Lesson learned.
So to wrap this up, the banks have the money and they’re wanting to lend. No different than the local dope pusher in your bad part of town. He’ll even give you your first dose free as the banks will give you a low teaser rate too in order to reel you in.
Are you buying? Nope.
Why economists can’t see this is beyond me. Wesbury even says “to be brief, government always uses crisis to grow and we would have never had the inflation we have today under the old model.” I literally don’t get that line of reasoning. But whatever. As my debt shrinks by the day, I become less concerned with the Fed and whatever silly policies they’re trying to implement.
I’m a lot more concerned with the EPA and what the Greens are doing to cause inflation. My Wholesale Power Cost Adjustment from my electricity provider went up from .019 a kWh to .045 a kWh over the last 2 months. That’s nearly a 150% increase in the cost of my electric bill, even though I used 500 kWhs less!
Yeah, tell me again how the Fed caused that inflation. They didn’t. Someone please, the American consumer is begging you, tell the economists if they wanna bring down inflation focus on what’s really causing it; THE GREENS!
Blessings,
Josh